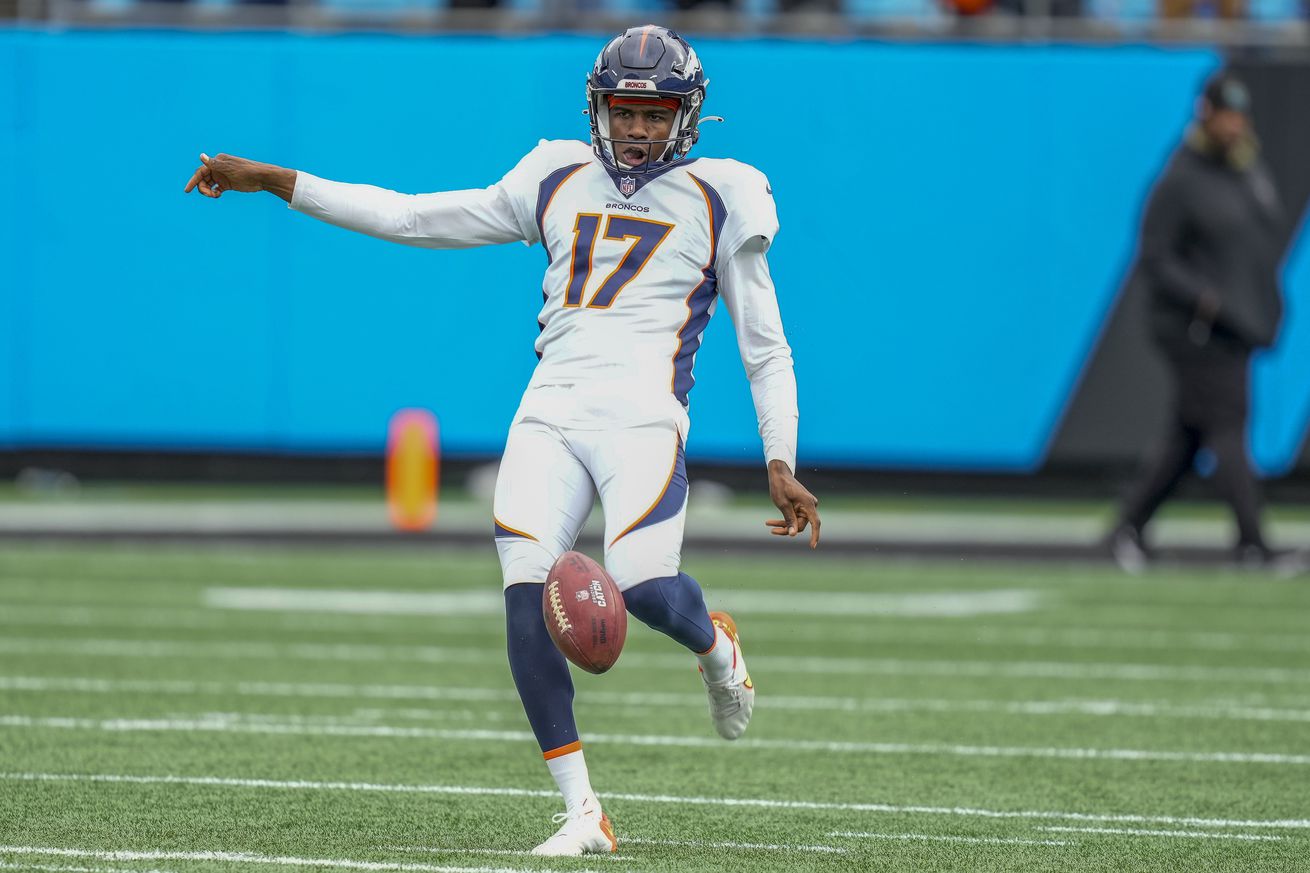
Corliss Waitman was not very good in 2022. Can he improve in 2023?
In order to save money, the Denver Broncos parted ways with punter, Sam Martin, during the preseason and choose to go with Corliss Waitman. Prior to this season, Waitman had seven NFL punts, but he outperformed Martin in training camp and won the job. Sam Martin had the fifth highest cap number among punters in 2021 and would have been high on the list in 2022.
Martin signed a 3 year contract with the Broncos before the 2020 season that could have been worth 7.1 million if he had played out the full contract. Had he played for the Broncos he would have had a cap number of 2.3 million for the 2022 season. He ended up playing for the Bills and had a cap number of 1.05 million for them. Waitman had a cap number of 825k for the Broncos in 2022, meaning that the choice to go with Waitman instead of Martin freed up roughly 1.5 million in cap space for the Broncos.
| Team | PPP | Net Avg | Net Yds | Punts | Avg | Lng | Yds | IN5 | IN5% | IN10 | IN10% | IN 20 | IN20% | OOB | OOB% | Dn | TB | TB% | FC | FC% | Ret | RET% |
| Packers | 28.8% | 40.4 | 2103 | 52 | 44.5 | 72 | 2313 | 4 | 7.7% | 16 | 30.8% | 24 | 46.2% | 4 | 7.7% | 9 | 1 | 1.9% | 18 | 34.6% | 20 | 38.5% |
| Steelers | 26.1% | 41.1 | 2835 | 69 | 44.5 | 69 | 3072 | 6 | 8.7% | 23 | 33.3% | 20 | 29.0% | 7 | 10.1% | 11 | 5 | 7.2% | 22 | 31.9% | 24 | 34.8% |
| 49ers | 21.3% | 39.7 | 2423 | 61 | 43.9 | 74 | 2676 | 5 | 8.2% | 18 | 29.5% | 32 | 52.5% | 6 | 9.8% | 16 | 5 | 8.2% | 17 | 27.9% | 17 | 27.9% |
| Browns | 19.7% | 41.0 | 2500 | 61 | 48.5 | 76 | 2959 | 7 | 11.5% | 19 | 31.1% | 23 | 37.7% | 8 | 13.1% | 11 | 7 | 11.5% | 9 | 14.8% | 26 | 42.6% |
| Vikings | 17.8% | 43.1 | 3144 | 73 | 47.4 | 73 | 3457 | 5 | 6.8% | 14 | 19.2% | 32 | 43.8% | 7 | 9.6% | 5 | 1 | 1.4% | 22 | 30.1% | 38 | 52.1% |
| Falcons | 17.7% | 41.2 | 2555 | 62 | 45.9 | 73 | 2845 | 1 | 1.6% | 13 | 21.0% | 23 | 37.1% | 6 | 9.7% | 7 | 2 | 3.2% | 22 | 35.5% | 25 | 40.3% |
| Texans | 17.0% | 42.6 | 3748 | 88 | 48.1 | 67 | 4229 | 5 | 5.7% | 19 | 21.6% | 37 | 42.0% | 6 | 6.8% | 11 | 4 | 4.5% | 22 | 25.0% | 45 | 51.1% |
| Chiefs | 17.0% | 45.6 | 2416 | 53 | 50.4 | 76 | 2672 | 6 | 11.3% | 13 | 24.5% | 22 | 41.5% | 3 | 5.7% | 8 | 4 | 7.5% | 16 | 30.2% | 22 | 41.5% |
| Jaguars | 13.8% | 43.8 | 2539 | 58 | 49.3 | 70 | 2862 | 6 | 10.3% | 14 | 24.1% | 24 | 41.4% | 4 | 6.9% | 9 | 6 | 10.3% | 10 | 17.2% | 29 | 50.0% |
| Seahawks | 13.6% | 44.4 | 2932 | 66 | 48.5 | 68 | 3199 | 2 | 3.0% | 12 | 18.2% | 22 | 33.3% | 8 | 12.1% | 8 | 3 | 4.5% | 12 | 18.2% | 35 | 53.0% |
| Raiders | 11.9% | 43.9 | 2590 | 59 | 48.9 | 67 | 2884 | 2 | 3.4% | 8 | 13.6% | 26 | 44.1% | 8 | 13.6% | 9 | 1 | 1.7% | 16 | 27.1% | 25 | 42.4% |
| Bears | 10.6% | 40.9 | 2697 | 66 | 46.0 | 63 | 3038 | 3 | 4.5% | 10 | 15.2% | 20 | 30.3% | 4 | 6.1% | 8 | 3 | 4.5% | 20 | 30.3% | 31 | 47.0% |
| Lions | 9.6% | 41.4 | 2152 | 52 | 48.6 | 66 | 2525 | 4 | 7.7% | 8 | 15.4% | 14 | 26.9% | 3 | 5.8% | 7 | 3 | 5.8% | 9 | 17.3% | 30 | 57.7% |
| Chargers | 9.6% | 41.5 | 3028 | 73 | 43.6 | 60 | 3186 | 4 | 5.5% | 12 | 16.4% | 28 | 38.4% | 6 | 8.2% | 10 | 5 | 6.8% | 33 | 45.2% | 19 | 26.0% |
| Eagles | 9.1% | 39.7 | 2185 | 55 | 44.5 | 59 | 2448 | 4 | 7.3% | 8 | 14.5% | 17 | 30.9% | 4 | 7.3% | 9 | 3 | 5.5% | 14 | 25.5% | 25 | 45.5% |
| Ravens | 8.8% | 40.9 | 2329 | 57 | 45.9 | 69 | 2618 | 6 | 10.5% | 12 | 21.1% | 26 | 45.6% | 3 | 5.3% | 5 | 7 | 12.3% | 20 | 35.1% | 22 | 38.6% |
| Dolphins | 8.2% | 40.6 | 2476 | 61 | 46.4 | 66 | 2828 | 1 | 1.6% | 7 | 11.5% | 28 | 45.9% | 3 | 4.9% | 11 | 2 | 3.3% | 15 | 24.6% | 30 | 49.2% |
| Giants | 8.1% | 40.6 | 3006 | 74 | 46.8 | 69 | 3463 | 5 | 6.8% | 15 | 20.3% | 26 | 35.1% | 7 | 9.5% | 6 | 9 | 12.2% | 24 | 32.4% | 28 | 37.8% |
| Cowboys | 7.4% | 42.8 | 2913 | 68 | 48.4 | 83 | 3291 | 4 | 5.9% | 11 | 16.2% | 27 | 39.7% | 1 | 1.5% | 6 | 6 | 8.8% | 23 | 33.8% | 32 | 47.1% |
| Bengals | 6.8% | 39.9 | 2352 | 59 | 45.4 | 65 | 2678 | 3 | 5.1% | 7 | 11.9% | 22 | 37.3% | 7 | 11.9% | 4 | 3 | 5.1% | 20 | 33.9% | 25 | 42.4% |
| Commanders | 6.0% | 43.0 | 3566 | 83 | 46.8 | 68 | 3885 | 2 | 2.4% | 10 | 12.0% | 37 | 44.6% | 5 | 6.0% | 13 | 5 | 6.0% | 26 | 31.3% | 34 | 41.0% |
| Cardinals | 6.0% | 40.9 | 2740 | 67 | 47.1 | 65 | 3157 | 3 | 4.5% | 8 | 11.9% | 18 | 26.9% | 4 | 6.0% | 6 | 4 | 6.0% | 16 | 23.9% | 37 | 55.2% |
| Colts | 5.7% | 41.2 | 2881 | 70 | 44.8 | 70 | 3133 | 4 | 5.7% | 7 | 10.0% | 28 | 40.0% | 9 | 12.9% | 10 | 3 | 4.3% | 22 | 31.4% | 26 | 37.1% |
| Panthers | 4.9% | 44.1 | 3574 | 81 | 48.5 | 68 | 3925 | 2 | 2.5% | 10 | 12.3% | 39 | 48.1% | 7 | 8.6% | 10 | 6 | 7.4% | 31 | 38.3% | 27 | 33.3% |
| Bills | 4.4% | 42.2 | 1901 | 45 | 47.7 | 67 | 2146 | 3 | 6.7% | 7 | 15.6% | 16 | 35.6% | 6 | 13.3% | 5 | 5 | 11.1% | 13 | 28.9% | 16 | 35.6% |
| Patriots | 3.8% | 36.3 | 2871 | 79 | 42.2 | 62 | 3338 | 6 | 7.6% | 13 | 16.5% | 22 | 27.8% | 10 | 12.7% | 6 | 10 | 12.7% | 19 | 24.1% | 34 | 43.0% |
| Rams | 2.8% | 42.0 | 2982 | 71 | 48.4 | 67 | 3434 | 1 | 1.4% | 6 | 8.5% | 19 | 26.8% | 11 | 15.5% | 6 | 4 | 5.6% | 14 | 19.7% | 36 | 50.7% |
| Saints | 2.6% | 41.6 | 3199 | 77 | 46.4 | 68 | 3571 | 5 | 6.5% | 9 | 11.7% | 32 | 41.6% | 6 | 7.8% | 13 | 7 | 9.1% | 25 | 32.5% | 26 | 33.8% |
| Broncos | 1.0% | 41.5 | 3988 | 96 | 46.6 | 59 | 4470 | 3 | 3.1% | 7 | 7.3% | 30 | 31.3% | 3 | 3.1% | 14 | 6 | 6.3% | 29 | 30.2% | 44 | 45.8% |
| Jets | 0.0% | 40.6 | 3366 | 83 | 46.9 | 72 | 3889 | 2 | 2.4% | 8 | 9.6% | 27 | 32.5% | 15 | 18.1% | 12 | 8 | 9.6% | 16 | 19.3% | 32 | 38.6% |
| Titans | 0.0% | 44.0 | 3963 | 90 | 53.1 | 74 | 4779 | 2 | 2.2% | 9 | 10.0% | 30 | 33.3% | 1 | 1.1% | 10 | 9 | 10.0% | 11 | 12.2% | 59 | 65.6% |
| Buccaneers | -1.3% | 41.6 | 3285 | 79 | 48.8 | 74 | 3859 | 1 | 1.3% | 9 | 11.4% | 22 | 27.8% | 9 | 11.4% | 7 | 10 | 12.7% | 21 | 26.6% | 32 | 40.5% |
Waitman did not have a very good season by just about every measure. Like I do after every season, I use my own methods to analyze the performance of every punter in the league which I call punt percentage, PP, and precision punt percentage, PPP.
The job of the punter, at it’s core, is to maximize field position. In other words, they are tasked with putting the other team in the worst possible position when you are forced to “surrender” on offense which means a punt.
Waitman’s generally poor performance was magnified by the fact that the Chiefs punter, Tommy Townsend, made first team All-Pro. He also put on a punting clinic against Denver in Denver this year, grossing 76, 62 and 61 on this three punts. Waitman’s longest gross punt of the year was 59, meaning that their punter beat our punter’s best on every single one of his punts in Denver. Townsend was also superb in yesterday’s AFCC.
Waitman punted 47 times in Denver this season (and 49 times on the road). He also outkicked the coverage on his longest kick (59) which was returned by DeAndre Carter for 28 yards – more on this later.
Analysis of the Full League (and Waitman)
So on every punt there are a certain number of “potential yards” that the punter could gain for his team. Gaining “all” of those yards earns a punt percentage of 100 for that punt
Punt percentage = actual yards netted/potential yards
actual yards = gross punt yards – return or touchback yardage
For example if you are punting from your own 48, the best possible outcome is a 51 yard punt (forcing the opposing team to start their drive at the one yard line). If you punt a ball that is fair caught at the 5, you have “gained” 47 of the 51 potential yards for your team – 47/51 = 92%. So you got a score of 92% (punt percentage) on that punt. The higher the average on your punt percentage, the better you are as a punter because you are winning the field position battle for your team. This is particularly true in a battle of punters like many Bronco games this season.
For short field punts, SFPs, the best possible outcome is downed at the 1. For long field punts, LFPs, I set the best possible outcome as a 65 yard net punt, something that most NFL punters are capable of doing.
Punt Percentage is one way to measure the performance of a punter. Other ways are touchback rate; fair catch rate; average return allowed; rate of punts downed inside the 20, the 10 or the 5; standard deviation of gross punt distance (how often do you hit terrible punts or how often do you “boom” great punts with distance and hang-time); and PPP, precision punt percentage.
Let’s start by viewing this from a team perspective since only a few teams had multiple punters (35 punters had 10 or more punts this year). Below are Waitman’s (Denver’s) ranks (out of 32) in terms of the standard punting metrics, punt percentage (PP) and precision punt percentage (PPP).
- Gross punt average – 19th
- Net punt average – 15th
- inside the 20 % – 24th
- inside the 10 % – 32th
- inside the 5 % – 23rd
- touchback % (lower is better) – 16th
- fair catch % (higher is better) – 14th
- returned punt % (lower is better) – 21st
- precision punt percentage (inside 10% – touchback %), PPP – 29th
- long field punt percentage – 15th
- short field punt percentage – 25th
| RANK | Team | Long Field Punt% | Short Field Punt% |
| 1 | Chiefs | 79.1% | 74.6% |
| 2 | Jaguars | 77.4% | 75.3% |
| 3 | Titans | 76.3% | 73.8% |
| 4 | Seahawks | 75.5% | 72.2% |
| 5 | Raiders | 74.0% | 72.9% |
| 6 | Ravens | 73.1% | 69.5% |
| 7 | Saints | 72.9% | 72.9% |
| 8 | Panthers | 72.8% | 75.4% |
| 9 | Texans | 72.7% | 76.9% |
| 10 | Lions | 72.6% | 70.7% |
| 11 | Bills | 72.6% | 73.6% |
| 12 | Vikings | 72.5% | 73.0% |
| 13 | Cowboys | 72.4% | 77.2% |
| 14 | Commanders | 72.0% | 74.7% |
| 15 | Broncos | 71.9% | 71.4% |
| 16 | Rams | 70.6% | 69.3% |
| 17 | Buccaneers | 69.6% | 73.8% |
| 18 | Chargers | 69.3% | 73.8% |
| 19 | Bears | 69.2% | 69.5% |
| 20 | Giants | 69.2% | 74.4% |
| 21 | Browns | 69.0% | 74.6% |
| 22 | Dolphins | 69.0% | 75.6% |
| 23 | Bengals | 68.2% | 69.6% |
| 24 | Colts | 68.1% | 69.5% |
| 25 | Steelers | 67.8% | 76.5% |
| 26 | Falcons | 67.6% | 74.8% |
| 27 | Jets | 67.3% | 76.7% |
| 28 | Cardinals | 66.8% | 73.9% |
| 29 | Packers | 66.8% | 76.6% |
| 30 | Eagles | 65.8% | 73.6% |
| 31 | 49ers | 63.6% | 75.2% |
| 32 | Patriots | 62.0% | 67.4% |
/cdn.vox-cdn.com/uploads/chorus_asset/file/24396010/Bar_graph_LFP_and_SFP_PP_full_lg_2022.png)
Joe Mahoney
I find it interesting that some punters were really good on SFPs and poor on LFPs while for others it was the reverse. Very few were really good on both.
Corliss Waitman was not in the top 10 of the league in any metric (save OoB%) and he was near the bottom of the league in many.
Now lets look at some of the above rankings in depth – keeping in mind that the coverage units can greatly hurt or help a punter in many of these.
The average punt percentage for all 1211 LFPs in 2022 was 70.7%. For all 943 SFPs that was 73.4%. So in general it was easier to maximize field position as a punter on SFPs.
The most frequent gross punt distance in the NFL in 2022 was 48 yards. 4.8% of all punts grossed 48. The longest punt grossed 83 while the shortest punt that was not totally blocked went 3 yards (happened twice). pic.twitter.com/AEDi0qdPfJ
— Joe Mahoney (@ndjomo76) January 24, 2023
Inside the 20 and Returned %
Waitman punted 96 times. 65 percent of those punts were LFPs – from inside the Broncos 35. That was one of the higher percentages in the league, which makes sense given how often our offense failed to move the ball. The Rams had the highest percentage of LFPs at 73 percent. Waitman had 61 LFPs and only 33 SFPs. The total of 61 LFPs was tied with the Texans for the most in the league. The 49ers had the fewest with 19.
Waitman got 30 punts downed inside the 20 – 31.3%. The 49ers’ punter, Mitch Wisnowsky, got the highest percentage downed inside the 20 with 52.5 percent. An accurate punter and a great defense are an amazing combo. Wisnowsky was the only punter above 50% and that definitely helped the 49ers defense finish first in points allowed. The Rams punter had the lowest inside the 20%, but he also had the highest percentage of LFPs.
It is much easier to get a punt inside the 20 on a SFP than a LFP. On a LFP that is fielded you have to either have a minimum gross of 46 yards (if fair catch is called) or a larger gross and a good coverage team (you can’t out-punt your coverage). The most common gross punt distance in the league in 2022 was 48 yards, so to get one downed inside the 20 on a LFP, the punter has to hit it really long and not out-punt the coverage.
In terms of average punt return allowed, Waitman (and our punt coverage unit) was/were 21st in returned percentage and 13th in average return allowed, but these make more sense when you factor in the high percentage of LFPs. It’s easier to have a punt downed or fair caught if you are punting with a the short field. 45.8 percent of Waitman’s punts were returned for an average of 8.2 yards. JK Scott, the Chargers’ punter, had the lowest percentage of his punts returned with 26.0 percent while the Titans’ punter, Ryan Stonehouse, had the highest percentage of his punts returned. Scott (and the Chargers’ punt coverage unit) were the best in the league allowing only 58 total punt return yards (3.8 per) and 15 of that came on one return. The other 18 returns against the Chargers gained a total of 43 yards (2.4 yards per) and eight of those were returned for zero or one yard.
Of course, the Chargers were also one of the teams most likely to go for it on 4th down. The had 29 4th down attempts this season which was the fifth most. When I’ve studied it in the past, about two thirds of 4th down attempts are not on game-on-the-line-in-the-4th-quarter situations, IOW, the coach could choose to punt or go for it. The Browns had the most 4th down attempts this past season with 42, but let’s get back to punting…
It would appear that Waitman out-punted the coverage on the occasions when he grossed more than 50 on a punt. The Broncos gave up 362 total punt return yards in 2022 (6th most – that’s bad). Waitman had 40 punts that grossed 50 or more yards (9 grossed exactly 50). 27 of those were returned for 272 yards (10.0 yards per return) – including that return of 28 mentioned earlier and returns of 21 and 19. Only 17 of his 56 shorter punts (< 50 yd gross) were returned and only two for more than 10 yards (one for 13 and one for 12).
So to summarize, when Waitman hit long punts, we allowed 10.0 yards per return. When he hit shorter punts, we allowed 5.3 yards per return. Looking at it another way, 68 percent of his long punts were returned while only 30 percent of his shorter punts.
In terms of our coverage unit, the Broncos only had three punts returned against them that were stopped for no gain (and none for negative yards). Only eight of those 44 punts returned against us were stopped for 5 or fewer yards, meaning that we gave up a large number of 6-12 yard punt returns when opponents chose to return them (26 to be exact). I think we ended up with injuries to many of the punt gunners so that could be a reason for our poor coverage. The guys who were good at being punt gunners were either hurt or back on the practice squad. That being said, if Waitman was not getting a lot of hang-time, then even the best gunners in the league are not going to be able to stop the 6-12 yard punt returns that so often gave up this season. So it would appear that Waitman was not good at hang-time.
Waitman was consistent in 2022 which was his first full season as an NFL punter. He generally avoided really short punts (he had two that grossed less than 30) and did not have one blocked (there were 12 in 2022), but he also had no really long punts. As you can see below, he had a really high percentage of 50 yard gross punts, but oddly zero punts that grossed 45. He had the second shortest long punt (59) of any punter in the league with more than 10 punts (Michael Palardy of the Patriots had a long of 58).
/cdn.vox-cdn.com/uploads/chorus_asset/file/24384949/waitman_2022_compared_to_lg_as_a_whole.png)
In terms of gross punt yardage Waitman was the second most consistent punter in the league. His standard deviation on gross punt distance was the second smallest in the league (7.5) behind Cameron Johnston (7.2). The most “boom or bust” punter in the league in 2022 was Corey Bojorquez with a standard deviation of 12.2 yards. Ideally a punter wants to have a high average gross distance and a small standard deviation, but this can be dramatically effected by having a high or a low percentage of SFPs or LFPs. I really should run the standard deviation on SFPs and LFPs separately, as it’s easier to have a low standard deviation when you have a very high percentage of SFPs. I have not done this though.
In terms of average gross punt yds, Corliss Waitman was below average in 2022, which is disheartening considering half his punts were at altitude. He did have one of the lowest standard deviations in the league meaning that he was at least consistent. He led lg in total punts. pic.twitter.com/kq9Jp4vTgU
— Joe Mahoney (@ndjomo76) January 24, 2023
If you separate Waitman’s average net on SFPs vs LFPs you find that he had an average net of 40.1 on SFPs and 42.4 on LFPs. Reading the tea leaves, I infer that he was trying to play the coverage/hang-time game. This led to a lack of really long punts. I can also infer that his hang-time was not great (and/or our punt coverage team was poor) because so many of the punt return yards that we allowed were on higher gross yardage punts. In other words, he had to sacrifice height (hang-time) for distance and that led to longer returns.
Inside the 10 and 5
Getting punts downed inside the 10 is generally a function of the skill of the punter. Getting them inside the 5 is more a function of luck and a good coverage team, but some elite punters (like Townsend) can reproducibly drive them OoB inside the 5. Corliss Waitman had the lowest inside the 10 percentage in the league at 7.3. Only seven of his 96 punts were downed/stopped inside the 10, but three of those seven were inside the 5. The Browns punter, Corey Bojorquez, had the most downed inside the five with seven (11.5%). Every team had at least one, but four teams had only one – the Falcons, Dolphins, Buccaneers and Rams.
The Steelers punter, Pressley Harvin III (who sounds like a hedge fund manager), was the best at pinning opponents inside the 10 with 23 punts. His 33.3% inside the 10 rate was the best in the league. Harvin is one of the drafted punters in the league as he was a 7th round pick of the Steelers in 2021.
2022 was a banner year for punters getting drafted with two getting taken in the 4th round. It was only the third time that has happened in the history of the NFL draft (last was in 2002). Surprisingly six punters have been taken in the first or second round with the most recent being former Bronco punter Todd Saeurbrun in 1995 (the Bears took him with the 56th overall pick). Of course the highest a punter has ever been drafted was 11th overall; Russell Erxleben was taken 11th overall by the Saints in 1979. They passed on Hall of Famers, Joe Montana and Kellen Winslow, to take a punter. They also passed on Mark Gastineau, Roy Green and Fred Smerlas. Thankfully no team has been stupid enough to draft a punter in the first round since. The highest a punter has been drafted since 1995 was 70th (Bryan Anger in 2012).
Touchback %
Given how often Waitman was punting with a long field, his ability to avoid touchbacks is not that remarkable. Six of his punts ended as touchbacks, but none were LFPs as that would mean that he would have grossed 65 or more on the punt and his long for the season was only 59. The worst in the league for touchbacks was 10 (two tied) while three punters only had one. From a percentage perspective, Ryan Wright of the Vikings, was the best at avoiding touchbacks. Only 1.4 percent of his punts ended as touchbacks (1 of 73).
Precision Punting
Because Waitman was average at avoiding touchbacks and poor at pinning the opponent inside the 10, he had one of the worst PPPs (precision punt percentages) in the league – 1.0 percent. Only the Jets, Titans (both at 0%) and the Buccaneers (negative 1.3%) were worse. The Packers Punter, Pat O’Donnell, was the best in 2022 with a PPP of 28.8 percent. He got 16 of 52 punts downed inside the 10 and only had one touchback. Compare that to Jake Camarda of the Bucs, who got nine downed inside the 10, but had ten touchbacks.
Fair Catch Percentage Forced
I tend to look at this as a proxy for hang-time. I don’t have a subscription to PFF which has the hang-time stats for punters, but it stands to reason that if you are maximizing hang-time most punt returners are going to fair catch the ball and not try to return it. Waitman was 14th in FC%. Scott was the best in the league as mentioned previously and Ryan Stonehouse of the Titans was the worst at 12.2%.
Of course we have to look at percentage of fielded punts to get a better view. Ryan Wright had the highest fielded percentage in the league with 82.2 percent of his punts being either returned or fair caught. Wisnowsky of the 49ers had the lowest with only 55.7 percent of his kicks being fielded. That stands to reason with how often Wisnowsky was punting on the short field. Many punt returners are told to let it bounce if it goes inside the 10, since the chances to a touchback are high and the chances of returning a SFP from inside the 10 to beyond the 20 are low.
A surefire way to avoid having your punts returned is to kick them out of bounds. Whether by design or by accident, Waitman had the third lowest OoB% in the league at 3.1%. Only Bryan Anger of the Cowboys and Ryan Stonehouse had lower OoB% percentages. Both had exactly one punt go OOB in 2022. Waitman had 3. On the other side of this equation you have Braden Mann of the Jets who had 18 punts go OoB in 2022 (18 percent); because of this he had the third lowest fielded rate in 2022.
Theoretically an elite hang-time punter would have a really high fair catch to return ratio. Waitman was almost exactly average with a ratio of 0.66 (29 fair caught and 44 returned). Only two punters had a value greater than one, Scott and Johnny Hekker of the Panthers. Hekker is a former 1st team All-Pro punter (4x).
1st team All-Pro Punter by season:
- 2022 – Tommy Townsend (undrafted)
- 2021 – AJ Cole (undrafted)
- 2020 – Jake Bailey (5th round pick)
- 2019 – Brett Kern (undrafted)
- 2018 – Michael Dickson (5th round pick)
- 2017 – Johnny Hekker (undrafted)
- 2016 – Johnny Hekker
- 2015 – Johnny Hekker
- 2014 – Pat McAfee (7th round pick)
- 2013 – Johnny Hekker
- 2012 – Andy Lee (6th round pick)
- 2011 – Andy Lee
I can’t remember the last time a Bronco punter even sniffed the Pro Bowl much less All-Pro, but Brett Kern did make first team All-Pro after leaving the Broncos and Todd Sauerbrun was All-Pro before coming to the Broncos. Long-time Bronco punter Tom Rouen was good, but never great. He led the league in gross average in 1999, but never made the Pro Bowl (Tom Tupa was the All-Pro punter in 1999). Roeun was the Bronco punter for a decade.
You have to go all the way back to Mike Horan in 1988 to find a Bronco punter who won post-season accolades. Mike was 1st team All-Pro and made the Pro Bowl that season. That would be his only season where he won post-season accolades.
It seems to be easy for other teams to find above average punters as undrafted college free agents (like Waitman). Yet the Broncos have not been able to find (or purchase) a top-tier punter in 25 years. Only 46 punters have been drafted this century with most being taken on day 3. Of the 35 punters who had more than 10 punts this year, about half were undrafted (17).
In terms of first team Pro Bowl nods, only 13 drafted punters have earned that honor and the Pro Bowl has existed since 1950. Elite punters are rare and tend to have long careers.
Of course having an elite punter is not going to fix the myriad or problems that currently face the Broncos, but it would make it a little easier to swallow when we are forced to punt as we often were in 2022.







You must be logged in to post a comment Login