Brian Fremeau
04 Jan 2023, 03:55pm

The College Football Playoff national championship matchup between the Georgia Bulldogs and the TCU Horned Frogs features our FEI preseason No. 1 team against our preseason No. 60 team. The defending champs are making their third playoff championship game appearance in six seasons and are on the cusp of becoming the first back-to-back champions in a decade. Their opponent had only four FBS wins in 2021 and had a four-year record including FCS opponents of only 23-24 (.489) heading into the year. Following a wild regular and bowl season, and a spectacular pair of New Year’s Eve semifinal games, an historic and unexpected finale awaits on Monday night.
We have grown accustomed over the last several years (and for most of the history of the game) to consider only a small number of programs to be truly viable contenders for national championships. In the first eight years of the CFP era, five programs claimed a title, and those five programs—Alabama, Georgia, Ohio State, Clemson, and LSU—also accounted for victories in 23 of the 24 playoff games played in that span. Those five programs also ranked among the eight teams with the highest “Blue Chip Ratios” heading into the season, a measure of the recruited talent composition of each team calculated annually by Bud Elliott of 247Sports that has served as a reliable baseline standard all potential championship contenders must first clear. Three of this year’s playoff field participants were safely in the tier of Blue Chip Ratio contenders. With only 17 of 85 scholarship players rated as former four- or five-star recruits, TCU was most certainly not.
Have Sonny Dykes and the Horned Frogs been squeezing exceptional performances out of a team assembled from less-than-exceptional individual pieces? Are they exposing the credibility of recruiting rankings with a roster that actually features more top-end talent than they have been credited with assembling? Are they punching above their weight, or are we reading the scale wrong?
TCU has notably been exceeding expectations all season, but they have not been fluky. The Fiesta Bowl win over Michigan felt at times (and especially during the 44-point third quarter) like a chaotic back-and-forth rollercoaster ride, but TCU never trailed and held a multiple-score lead on 25 of the game’s 35 non-garbage possessions. They have been comeback specialists in 2022, winning five games after trailing in the second half, but they have also won blowouts and slugfests wire to wire. The Big 12 didn’t feature multiple behemoths like other conferences this season, but it was the heartiest gauntlet of above-average competition faced by any of the playoff participants. TCU earned it each week.
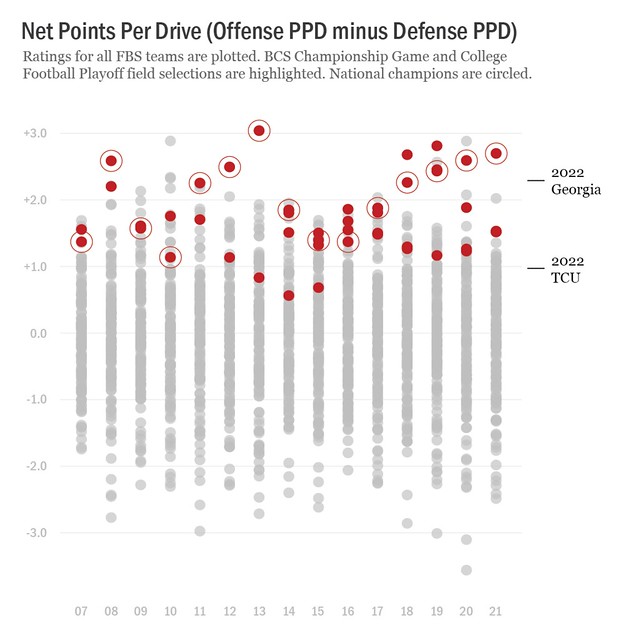
They do not have the statistical profile of a typical national champion, however, and they’re facing a formidable challenge in the championship game against an opponent that does. Each of the last four winners of the College Football Playoff, and eight of the last 14 national champions, finished the season with a net points per drive advantage of at least +2.0. Every national champion since 2007 has finished the season with a net points per drive advantage of at least +1.0. The Horned Frogs currently sit below that threshold.
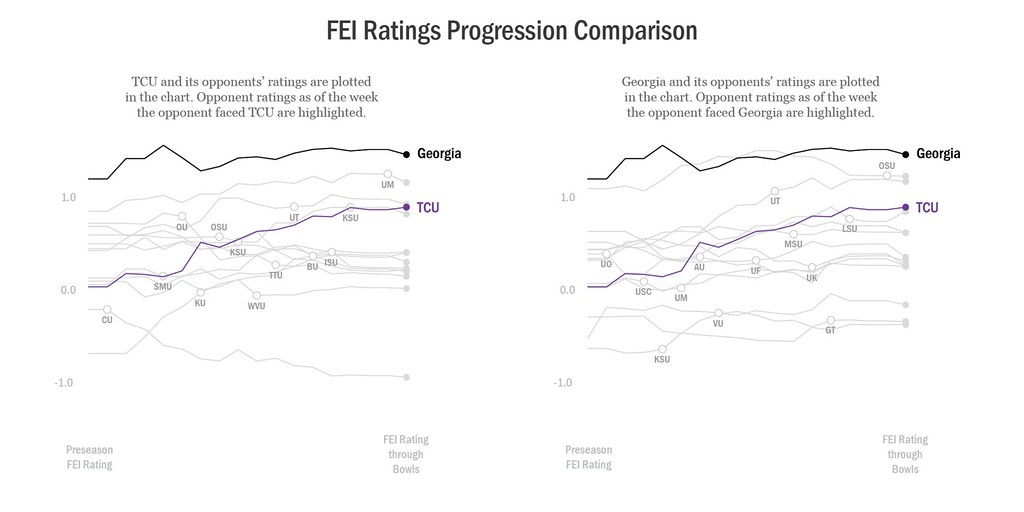
Georgia has simply had a more dominant and efficient season than TCU on both offense and defense. The Horned Frogs have been stronger on special teams overall, but Georgia has tipped the field position scale in their favor more frequently than TCU, so they aren’t likely to find an advantage in that phase either. Georgia isn’t just the best opponent TCU will have faced this season, they’re substantially stronger than the next best (Michigan). And TCU rates as merely the third-best opponent the Bulldogs will have faced, behind both Ohio State and Tennessee.
Advantages will be hard to come by for TCU against Georgia, and they’ll likely need to generate extraordinary possession change value (like a turnover return touchdown, or two, perhaps) to keep this one within a couple of scores. FEI projects the Bulldogs to cover the 12.5-point spread by a small margin and add a little more hardware to the trophy cases in Athens. There is roughly a 1-in-5 chance for an upset, which in and of itself wouldn’t be the most shocking result of the year. But a TCU victory would force us all to recalibrate all of our expectations once again, not only for what might be possible for one team in one special season, but for what might be possible in the future for many more programs that have never even dared such dreams.
2022 FEI Ratings (through Bowl Games)
Fremeau Efficiency Index ratings (FEI) are opponent-adjusted possession efficiency data representing the per-possession scoring advantage a team would be expected to have on a neutral field against an average opponent. Offense ratings (OFEI) and defense ratings (DFEI) are opponent-adjusted drive efficiency data representing the per-drive scoring advantage a team unit would be expected to have against an average opponent unit. Net drive efficiency (NDE) is the sum of offensive drive efficiency and defensive drive efficiency data representing scoring value earned by offense and defense units per drive. Strength of schedule ratings represent the expected number of losses an elite team two standard deviations better than average would have against each team’s schedule to date (ELS), the expected number of losses a good team one standard deviation above average would have against the schedule to date (GLS), and the expected number of losses an average team would have against the schedule to date (ALS). Ratings for all 131 teams are found here, and expanded ratings including projected win totals are found here.
| Rk | Team | Rec | FBS | FEI | OFEI | Rk | DFEI | Rk | NDE | Rk | ELS | Rk | GLS | Rk | ALS | Rk |
|---|---|---|---|---|---|---|---|---|---|---|---|---|---|---|---|---|
| 1 | Georgia | 14-0 | 13-0 | 1.46 | 1.72 | 4 | 1.36 | 1 | 2.22 | 1 | 1.95 | 8 | 5.19 | 5 | 9.19 | 6 |
| 2 | Ohio State | 11-2 | 11-2 | 1.23 | 1.83 | 2 | .83 | 9 | 2.07 | 2 | 1.92 | 10 | 4.41 | 21 | 7.96 | 26 |
| 3 | Alabama | 11-2 | 10-2 | 1.21 | 1.37 | 8 | 1.02 | 5 | 1.59 | 4 | 1.85 | 13 | 5.04 | 7 | 8.38 | 15 |
| 4 | Tennessee | 11-2 | 10-2 | 1.17 | 1.78 | 3 | .38 | 34 | 1.47 | 6 | 1.97 | 6 | 4.64 | 15 | 7.99 | 23 |
| 5 | Michigan | 13-1 | 13-1 | 1.16 | 1.26 | 10 | 1.02 | 6 | 1.96 | 3 | 1.54 | 22 | 4.14 | 30 | 7.69 | 34 |
| 6 | Texas | 8-5 | 8-5 | .92 | .97 | 16 | .82 | 10 | .96 | 21 | 1.60 | 20 | 5.00 | 8 | 9.37 | 4 |
| 7 | TCU | 13-1 | 12-1 | .89 | 1.14 | 12 | .66 | 19 | .96 | 20 | 1.70 | 16 | 5.18 | 6 | 9.37 | 3 |
| 8 | Penn State | 11-2 | 11-2 | .88 | .84 | 21 | 1.05 | 4 | 1.51 | 5 | 1.64 | 18 | 4.14 | 29 | 7.82 | 29 |
| 9 | LSU | 10-4 | 9-4 | .85 | 1.35 | 9 | .69 | 17 | 1.01 | 17 | 2.59 | 1 | 5.93 | 1 | 9.57 | 2 |
| 10 | Kansas State | 10-4 | 9-4 | .82 | .96 | 18 | .74 | 15 | .70 | 30 | 1.96 | 7 | 5.81 | 2 | 10.30 | 1 |
| 11 | Florida State | 10-3 | 9-3 | .79 | 1.37 | 7 | .34 | 36 | 1.31 | 7 | .77 | 57 | 3.24 | 51 | 7.29 | 43 |
| 12 | Utah | 10-4 | 9-4 | .77 | .96 | 17 | .56 | 25 | 1.12 | 12 | 1.14 | 39 | 4.07 | 33 | 7.98 | 24 |
| 13 | USC | 11-3 | 11-3 | .64 | 1.86 | 1 | -.57 | 107 | 1.06 | 15 | 1.01 | 45 | 3.84 | 37 | 7.97 | 25 |
| 14 | Mississippi State | 9-4 | 8-4 | .62 | .45 | 38 | .75 | 13 | .35 | 44 | 2.03 | 5 | 4.96 | 9 | 8.62 | 13 |
| 15 | Oregon | 10-3 | 9-3 | .62 | 1.38 | 6 | .10 | 50 | 1.15 | 9 | 1.42 | 24 | 3.80 | 39 | 7.30 | 41 |
| 16 | Oregon State | 10-3 | 9-3 | .60 | .45 | 37 | .82 | 11 | .95 | 22 | .87 | 50 | 3.49 | 46 | 7.28 | 44 |
| 17 | Washington | 11-2 | 10-2 | .58 | 1.53 | 5 | -.30 | 84 | 1.13 | 11 | .80 | 55 | 2.86 | 59 | 6.32 | 62 |
| 18 | Clemson | 11-3 | 10-3 | .56 | .25 | 49 | .84 | 8 | .83 | 24 | 1.16 | 38 | 3.74 | 40 | 7.70 | 33 |
| 19 | Minnesota | 9-4 | 8-4 | .56 | .53 | 33 | .66 | 18 | 1.11 | 13 | .64 | 67 | 2.61 | 62 | 6.08 | 65 |
| 20 | Illinois | 8-5 | 7-5 | .53 | -.02 | 64 | 1.06 | 3 | .81 | 25 | 1.00 | 47 | 3.20 | 53 | 6.94 | 53 |
| 21 | Tulane | 12-2 | 11-2 | .51 | .69 | 26 | .53 | 27 | 1.13 | 10 | .63 | 70 | 2.91 | 58 | 6.97 | 52 |
| 22 | Ole Miss | 8-5 | 7-5 | .48 | 1.07 | 14 | .08 | 52 | .52 | 36 | 1.30 | 31 | 4.06 | 34 | 8.03 | 21 |
| 23 | Notre Dame | 9-4 | 9-4 | .48 | .44 | 39 | .42 | 32 | .73 | 29 | 1.02 | 43 | 3.15 | 54 | 7.11 | 48 |
| 24 | Louisville | 8-5 | 8-5 | .46 | .10 | 57 | .75 | 14 | .57 | 35 | .65 | 66 | 3.27 | 48 | 7.79 | 32 |
| 25 | Arkansas | 7-6 | 6-6 | .42 | .77 | 23 | .06 | 56 | .10 | 57 | 1.32 | 30 | 4.35 | 22 | 8.64 | 12 |
| 26 | Iowa | 8-5 | 7-5 | .41 | -.61 | 99 | 1.26 | 2 | .15 | 53 | 1.52 | 23 | 3.91 | 36 | 7.34 | 40 |
| 27 | Oklahoma | 6-7 | 6-7 | .41 | .70 | 25 | .22 | 43 | .33 | 47 | 1.41 | 25 | 4.54 | 19 | 8.61 | 14 |
| 28 | Texas Tech | 8-5 | 7-5 | .41 | .31 | 46 | .55 | 26 | .04 | 59 | 1.26 | 33 | 4.61 | 17 | 9.06 | 7 |
| 29 | Maryland | 8-5 | 8-5 | .37 | .38 | 40 | .34 | 35 | .39 | 41 | 1.58 | 21 | 3.81 | 38 | 7.30 | 42 |
| 30 | Florida | 6-7 | 5-7 | .36 | .78 | 22 | -.04 | 60 | -.17 | 73 | 2.37 | 2 | 5.63 | 3 | 9.00 | 8 |


You must be logged in to post a comment Login